Get your ticket to DUTCH Fest 2026! Join us March 12-14 in Dallas, TX for cutting-edge hormone education and hands-on learning. Learn more and register today.*
*DUTCH Fest is exclusive to registered DUTCH Providers. Only registered DUTCH Providers can attend.
Goodbye Pie Chart, Hello Phase 1 Sliders
Allison Smith, ND
As we usher in a new era of DUTCH testing which leaves behind the concept of the three-way ratio that compared 2-OH-E1, 4-OH-E1, and 16-OH-E1 in favor of the two-way ratios that directly compare 4-OH-E1 to 2-OH-E1 and 16-OH-E1 to 2-OH-E1, it’s important to align on why we are making this change and exactly how we convey the Phase 1 estrogen metabolism data on the DUTCH report.
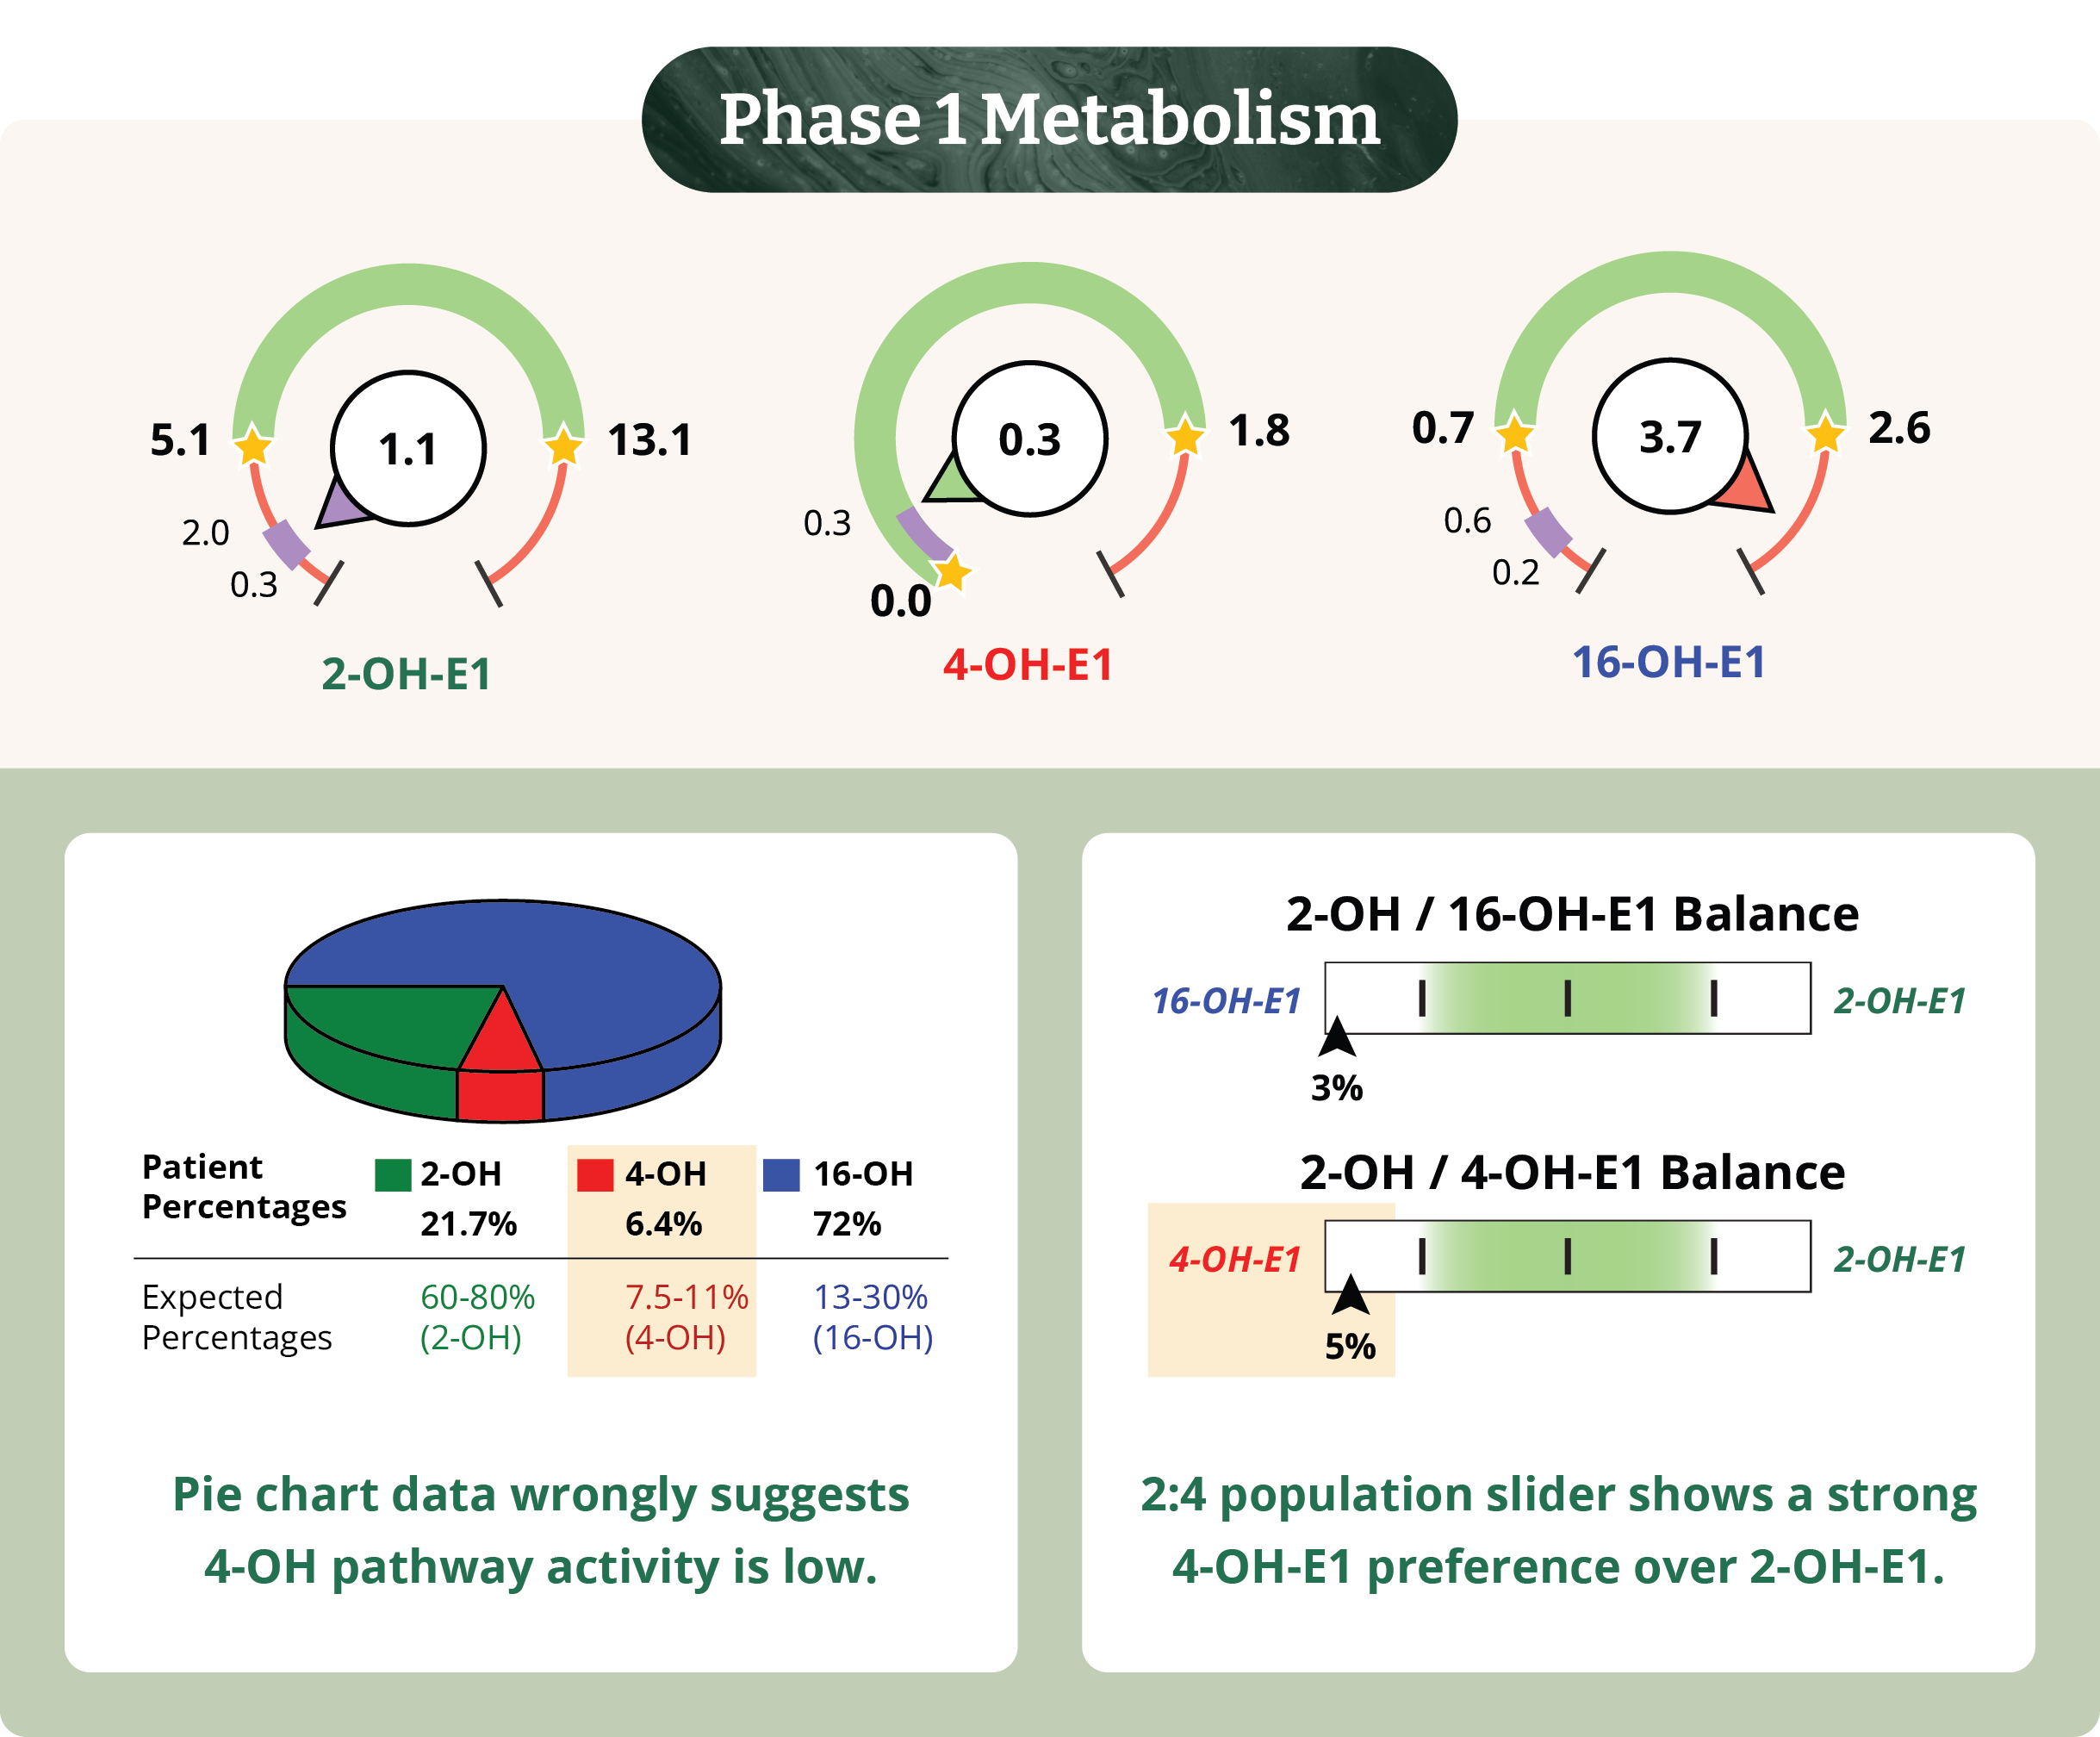
Why is the Estrogen Metabolism Phase 1 three-way ratio pie chart being removed from the report?
- Our aim is to create consistency with published research (including our own) on Phase 1 metabolism of estrogen which assesses 2-OH/4-OH-E1 (2:4) and 2-OH:16-OH-E1 (2:16) ratios as direct ratios
- To tease out important concepts which were previously lumped together in the pie chart assessment, including:
- Low 2:4 ratio – genotoxic risk
- Low 2:16 ratio – high estrogenic activity
- In order to reduce potential error in assessment of 4-OH-E1
- When 16-OH-E1 is dominant (as commonly found in endometriosis, fibrocystic breast disease, autoimmune disease, gut dysbiosis, and even with first pass metabolism of oral or sublingual estriol), the 3-way pie chart ratios can misrepresent 4-OH-E1 as normal or low even when it is highly dominant over 2-OH-E1
- This can lead to an incorrect assessment of 4-OH-E1 and undertreatment or choosing a treatment that may exacerbate a low 2:4 ratio (4-OH preference)

Where can I find the actual 2:16 ratio and 2:4 ratio on the DUTCH report?
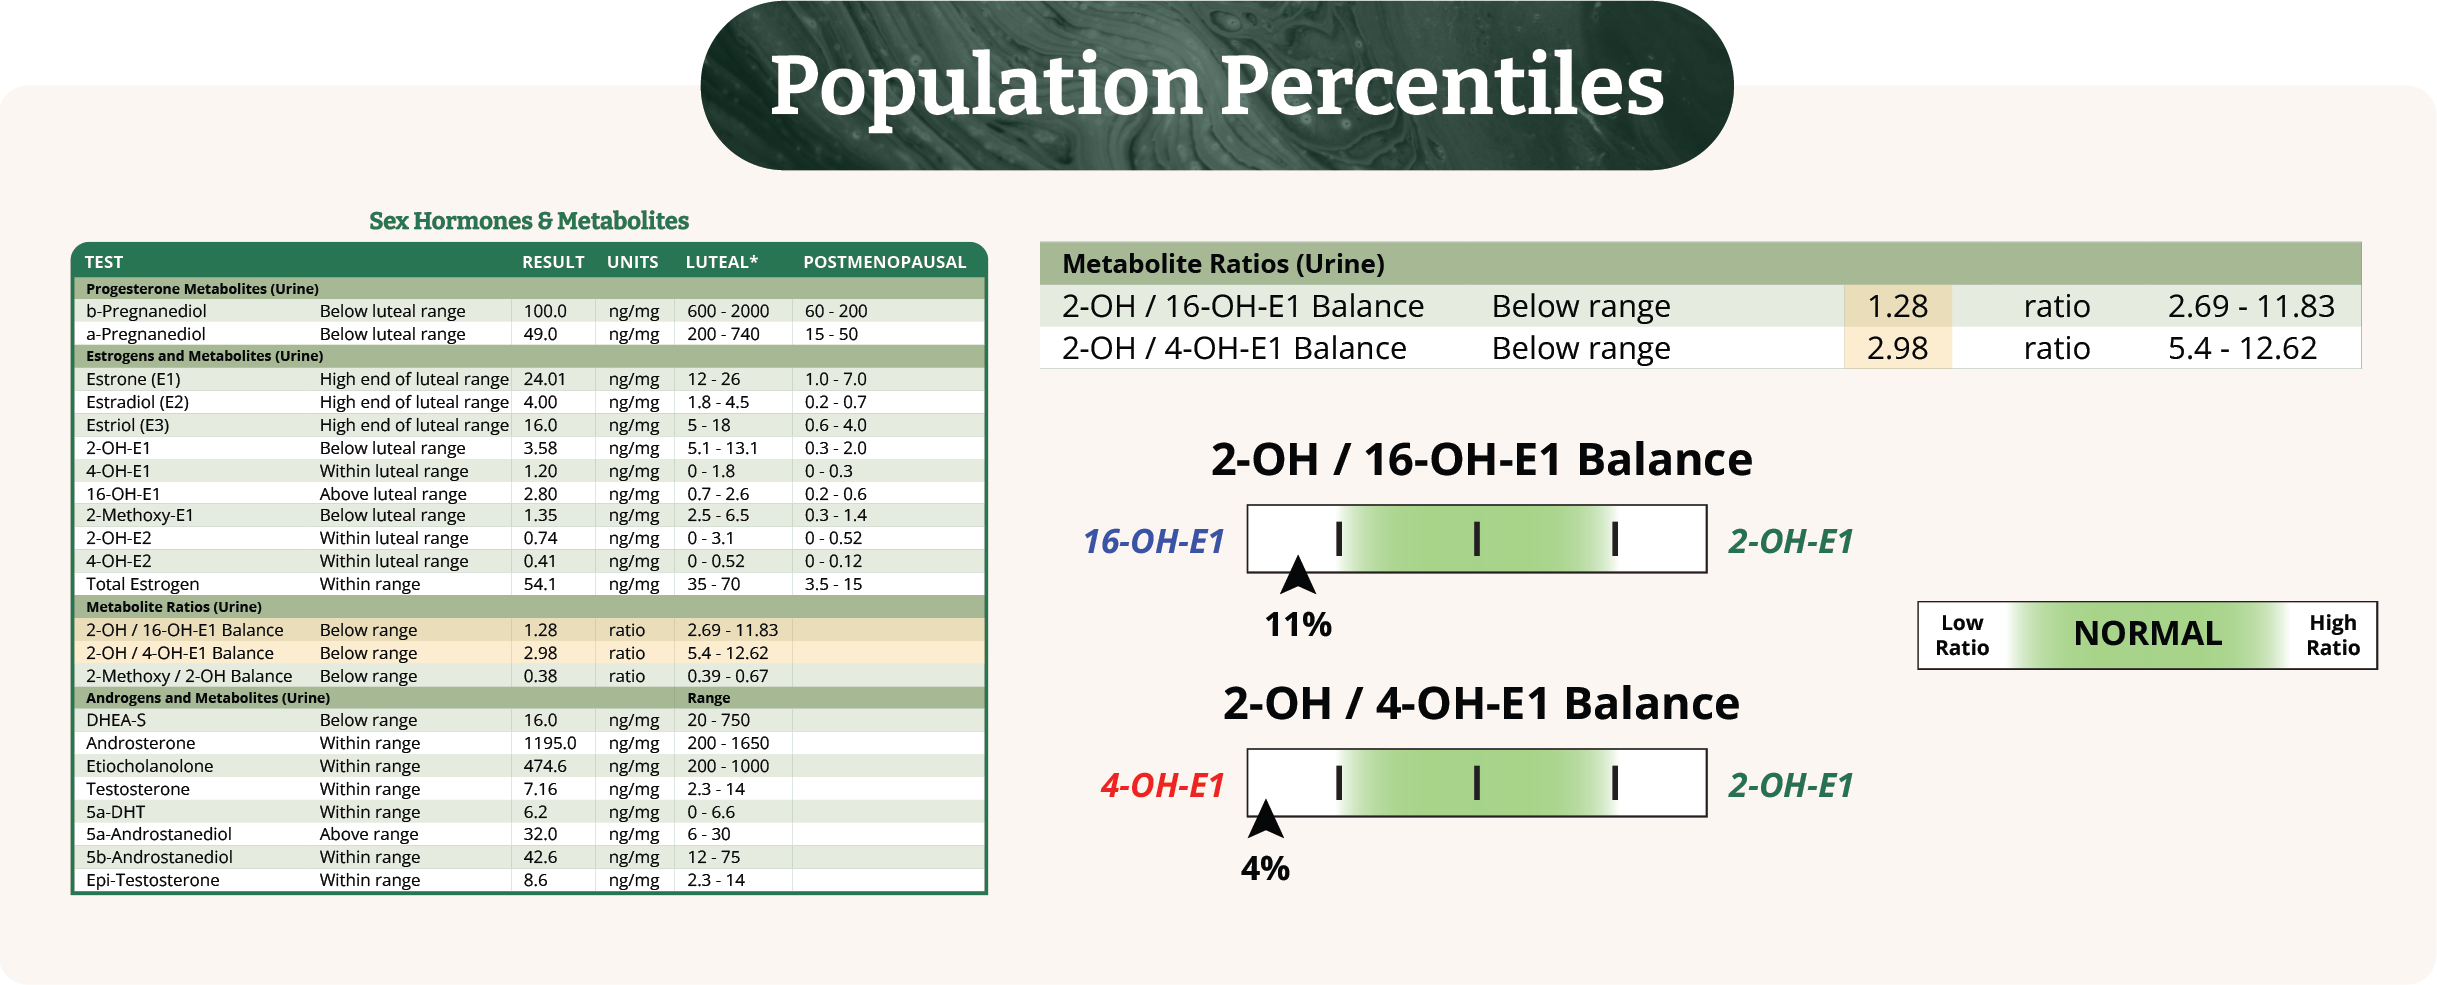
The 2:16 ratio and 2:4 ratio can always be found on the Sex Hormones and Metabolites page’s table list of findings. This is page 3 of a DUTCH Complete, DUTCH Plus, and DUTCH Sex Hormones Panel. These ratios inform the population percentiles which are presented in slider bars located on the Hormone Testing Summary page 1 and also on the Expanded Sex Hormones and Androgens page 2.
Remember, within these ratios the 2-OH-E1 is in the numerator and the 16-OH and 4-OH-E1 are the denominators. This means that if 16-OH or 4-OH-E1 are high relative to 2-OH-E1, that ratio becomes very low. Conversely, if they’re low compared to 2-OH-E1, then those ratios become high. For instance, when a person uses diindolylmethane (DIM), we will often see an ‘above range’ 2:16 ratio which falls into the population percentile greater than the 80th%, which indicates a strong 2-OH preference over 16-OH-E1.
What do the percentages (%) mean on the Phase 1 Slider Bars for 2-OH/16-OH-E1 Balance and 2-OH/4-OH-E1 Balance?
The 2:4 and 2:16 ratios inform the Phase 1 population sliders displayed on pages 1 and 2 of the DUTCH Complete, Plus, and Sex Hormones Panel. The population percentile sliders answer the question, “Where does my patient’s ratio fall compared to the population?” A low 2/4 or 2/16 ratio will fall below the normal expectation in the population range into a percentile less than the 20th%. A high 2/4 or 2/16 ratio will be expressed in the percentile slider greater than the 80th%.
In the example below, we can see the patient has a 2/16 ratio of 1.28. This falls below the normal range. How does this compare to the population?

Within the population, this patient has a 2/16 ratio higher than only 11% of people. Maybe more importantly, this also means that they’re lower than 89% of people in that population. And because a low 2:16 ratio represents a strong preference for the 16-OH-E1 over the 2-OH-E1, this person has a higher risk phase one metabolism.
Applying the same rationale to the 2:4 ratio, we can see the 2/4 balance is 2.98 which is below normal range. Within the population, this patient has a 2/4 ratio higher than only 4% of people and that means they’re lower than 96% of people in that population. This represents a strong preference for the 4-OH-E1 over the 2-OH-E1 and potential for more genotoxic activity especially when inflammation and oxidative stress is present.

Does it ever make sense to treat a patient based on Phase 1 metabolism ratios that fall within the normal population percentile range?
Absolutely! Remember, even a “normal” Phase 1 ratio can be actionable depending on other aspects of a patient’s risk profile, their symptoms, hormone levels, their relative balance, and presence of indicators of oxidative stress burden (high 8-OHdG and pyroglutamate, high cortisol clearance rate, etc).
Below, notice the 2:4 balance is within the normal range but toward the lower edge of normal. We see this patient has a strong preference toward 16-OH-E1. The next step could be to assess markers of oxidative stress and inflammation which drives 4-OH-E1's genotoxicity - the presence of high cortisol, quinolinate, 8-OHdG, and/or pyroglutamate levels on the DUTCH test may help determine the need to treat a mild preference for 4-OH-E1.

We hope you discover the value of using the 2:4 and 2:16 ratio data and population percentile sliders for more fully and reliably representing a person’s Phase 1 estrogen metabolism as we retire our old friend, the DUTCH Phase 1 Pie Chart. To health!
TAGS
Women's Health
Estrogen
Estrogen Detoxification
Estrogen Metabolism
DUTCH Test: Basic Interpretation Resources
Laboratory Testing: In-Depth Look at DUTCH Urine Testing